
Numbers & trends
Reports & forecast
Pipeline & revenue
Reports are available to organisation Admins and Agents, and only while the Reports section is switched on for you. The page has four tabs — Overview, Invoices, Purchasing and Trends — combining sales, quotation, revenue, invoicing, customer-growth, procurement spend, margin, and stock reporting. The Overview and Trends tabs carry date range presets: Last 30 days, Last 3 months, Last 6 months, Last 12 months and This year; the Invoices and Purchasing tabs have their own filters instead. A linked forecast view takes the pipeline further with forward-looking revenue projections.
Two of those tabs are section-gated as well. Invoices only appears when the Invoicing section is switched on for you, and Purchasing only when Procurement is. Opening either by direct link without the section drops you back on Overview, and with Reports itself switched off the page is not reachable at all.
The Invoices tab carries a Gross / Net tax-basis selector, defaulting to Gross. Gross totals include VAT; Net strips it out. Switch to Net when you are comparing against figures your accountant reports excluding VAT.
Sales pipeline and quotations
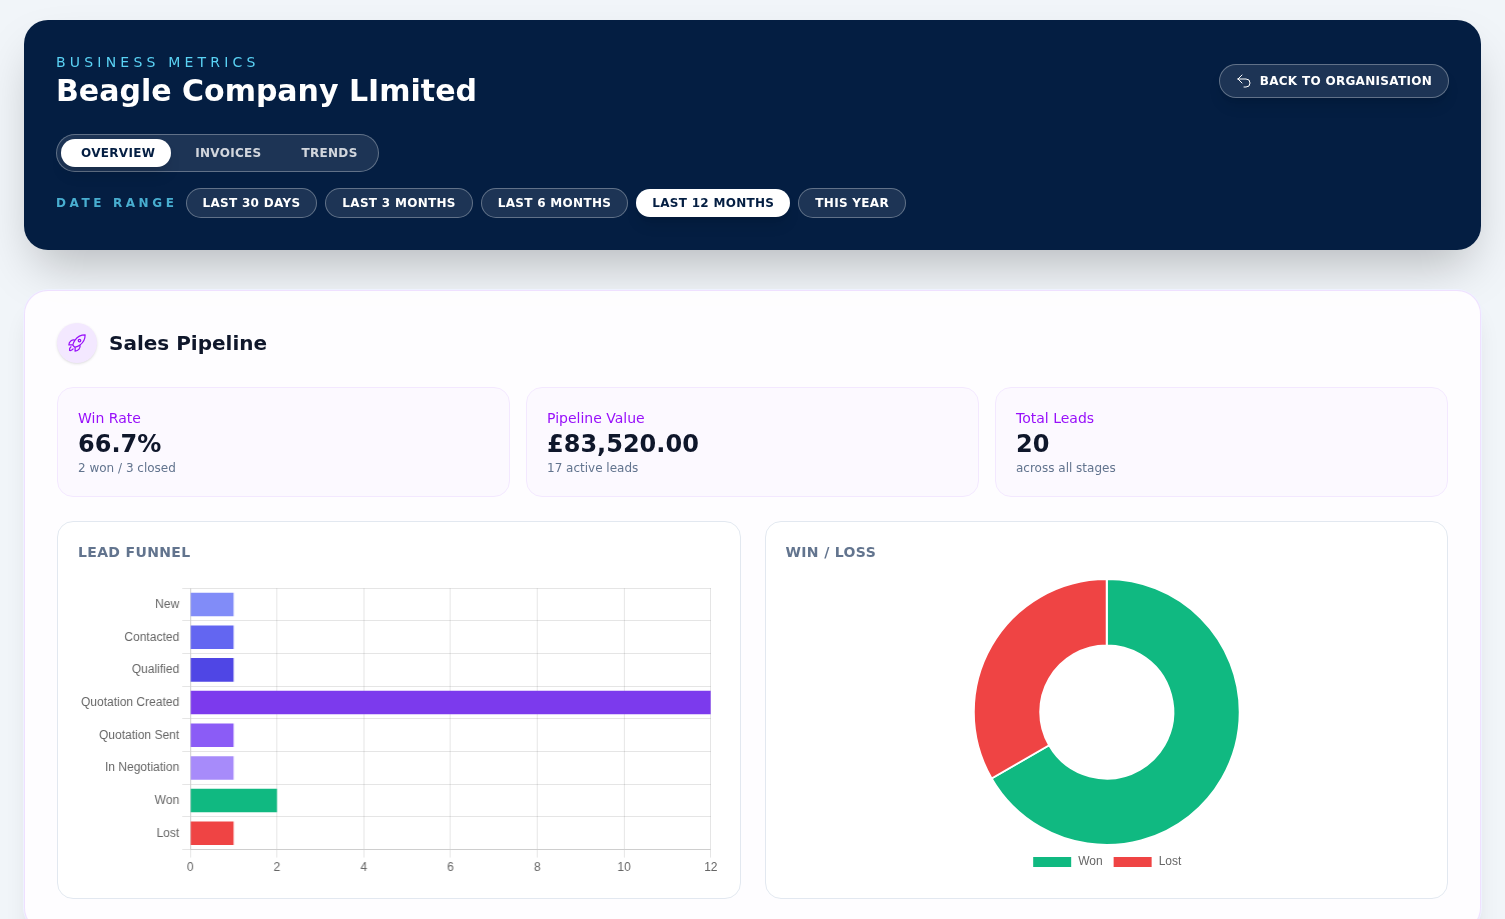
Reports include lead funnel totals, pipeline value by stage, win/loss rate, quote win rate, average deal size, average days to close, and monthly quotes sent, won, and lost.
Revenue and invoice health
Revenue reporting includes monthly revenue trend, recurring versus one-off revenue, outstanding and overdue invoices, invoice aging, pending orders, awaiting invoicing, and cancelled orders. If your organisation is VAT registered, the same section adds a VAT due (this month) tile — tax you are holding for HMRC, kept out of the revenue figures beside it.
Customer growth
The customer section shows new customers per month, active versus inactive counts, and top customers ranked by paid invoice revenue, with direct links back to those customer records.
Forecast
The Overview tab closes with a Sales Forecast section of its own — Next Quarter, 6-Month Forecast and 12-Month Forecast tiles over a revenue forecast chart, with a View full forecast link beside the heading. The linked forecast view then opens with four tiles — 12-Month Forecast, Next Quarter, Pipeline Value and a Data Quality indicator — plus a month-by-month forecast chart based on open pipeline and quotation data.
The Purchasing tab
Purchasing answers what you are spending, what you still owe, and what your stock is worth. It has its own From and To date boxes rather than the shared presets, opening on the past year. Five tiles head the tab: Spend (non-void bills in range), Owed to suppliers (with the overdue amount and bill count beneath it), Stock valuation (at cost, tracked products only), Product revenue (invoiced product lines, net) and Gross margin (with the margin percentage and the cost it is worked out from).
Purchasing charts and tables
Under the tiles, Spend by month charts what you have been billed across the range, and Top suppliers by spend ranks suppliers by Supplier, Bills and Spend, each row linking back to the supplier record. Below those, Margin by product breaks the figures down by Product, Units, Revenue, Cost and Margin, and Stock movements groups the stock ledger by Reason, Movements, Units in and Units out. Every panel follows the From and To dates you set.
Downloading the figures
The Purchasing tab carries three downloads — Purchase orders CSV, Bills CSV and Stock ledger CSV — and each one carries the From and To dates you have set, so the file matches what is on screen. The Invoices tab has its own CSV download of one row per invoice, plus a ZIP export of the matching invoice PDFs, which is prepared in the background and announced with a banner at the top of Reports when it is ready. All of them follow that tab's filters, including the Gross / Net basis.
